
Least Sold Services Report
The Least Sold Services report provides insight into services with the lowest sales and booking activity during the selected reporting period. It helps identify underperforming services, analyse demand patterns, and support service improvement and business decisions.
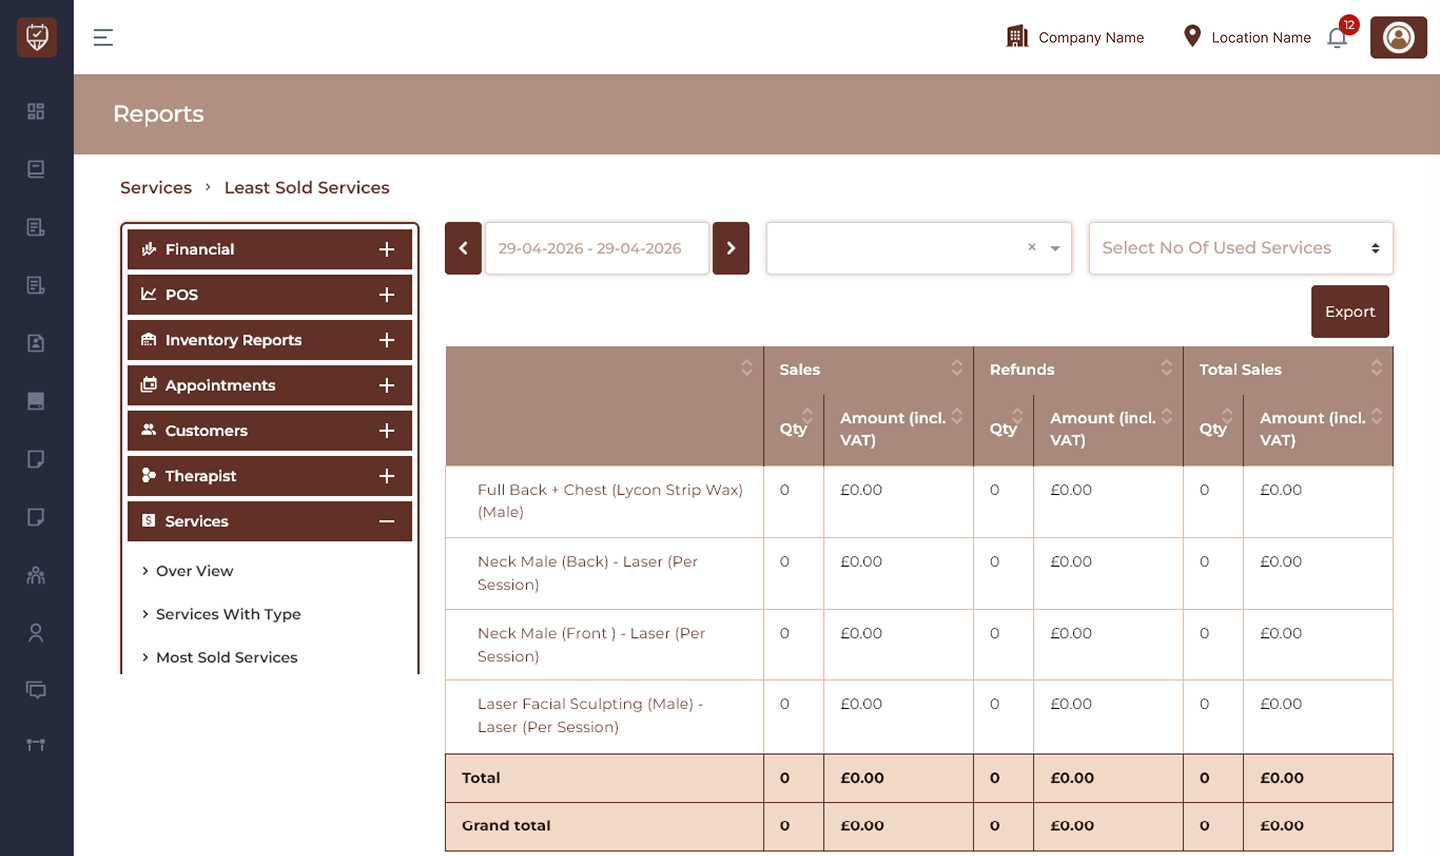
Date Range Filter
Allows users to display least sold services for a selected reporting period.
Features
- Filter service performance by date range.
- Review low-performing services.
- Analyse service trends.
- Generate period-based reports.
Purpose
Used to evaluate service performance within a selected timeframe.
Search Service Filter
Allows users to search and display a specific service.
Features
- Search services quickly.
- Narrow report results.
- View service-specific performance.
- Improve report analysis.
Purpose
Used to analyse individual service activity.
Select No Of Used Services Filter
Allows users to filter services based on usage count.
Features
- Filter services by booking quantity.
- Identify low-demand services.
- Compare service performance.
- Support service optimisation.
Purpose
Used to review services based on usage frequency.
Export
Downloads the currently displayed report.
Features
- Export report data.
- Support offline analysis.
- Maintain historical records.
- Simplify reporting.
Purpose
Creates a downloadable Least Sold Services report.
Least Sold Services Table
Displays service performance including sales, refunds, and final sales totals.
Service Name
Displays the service name.
Examples:
- Full Back + Chest (Lycon Strip Wax) (Male)
- Neck Male (Back) – Laser (Per Session)
- Laser Facial Sculpting (Male) – Laser (Per Session)
Features
- View low-performing services.
- Compare service demand.
- Analyse service usage.
- Identify improvement opportunities.
Purpose
Used to monitor underperforming services.
Sales Section
Displays completed sales for each service.
Qty
Displays the total number of completed service bookings.
Amount (incl. VAT)
Displays total sales revenue including VAT.
Features
- Track completed service sales.
- Measure service usage.
- Monitor generated revenue.
Purpose
Used to review completed sales activity.
Refunds Section
Displays refunded service activity.
Qty
Displays total refunded bookings.
Amount (incl. VAT)
Displays refund amount including VAT.
Features
- Monitor refund activity.
- Track revenue adjustments.
- Evaluate service issues.
Purpose
Used to analyse refunded transactions.
Total Sales Section
Displays final sales values after refund adjustments.
Qty
Displays final completed quantity.
Amount (incl. VAT)
Displays final revenue including VAT.
Features
- Measure final performance.
- Compare sales and refunds.
- Analyse net revenue.
Purpose
Used to evaluate actual service results.
Total
Displays subtotal values for the current report.
Includes:
- Sales quantity.
- Sales amount.
- Refund quantity.
- Refund amount.
- Final sales quantity.
- Final sales amount.
Purpose
Provides a summary of displayed report values.
Grand Total
Displays overall totals across all matching services.
Includes:
- Total completed sales.
- Total refund values.
- Overall quantities.
- Final total sales amount including VAT.
Purpose
Provides complete visibility of least sold service performance.
Best Practices
- Review underperforming services regularly.
- Compare usage and sales trends.
- Identify opportunities for promotions.
- Use filters for targeted analysis.
- Export reports for business review.