
POS Summary
The POS Summary Report page provides an overall financial overview of point-of-sale activity during the selected reporting period. It helps administrators monitor sales performance, review refunds and discounts, analyze net revenue, and evaluate business activity trends.
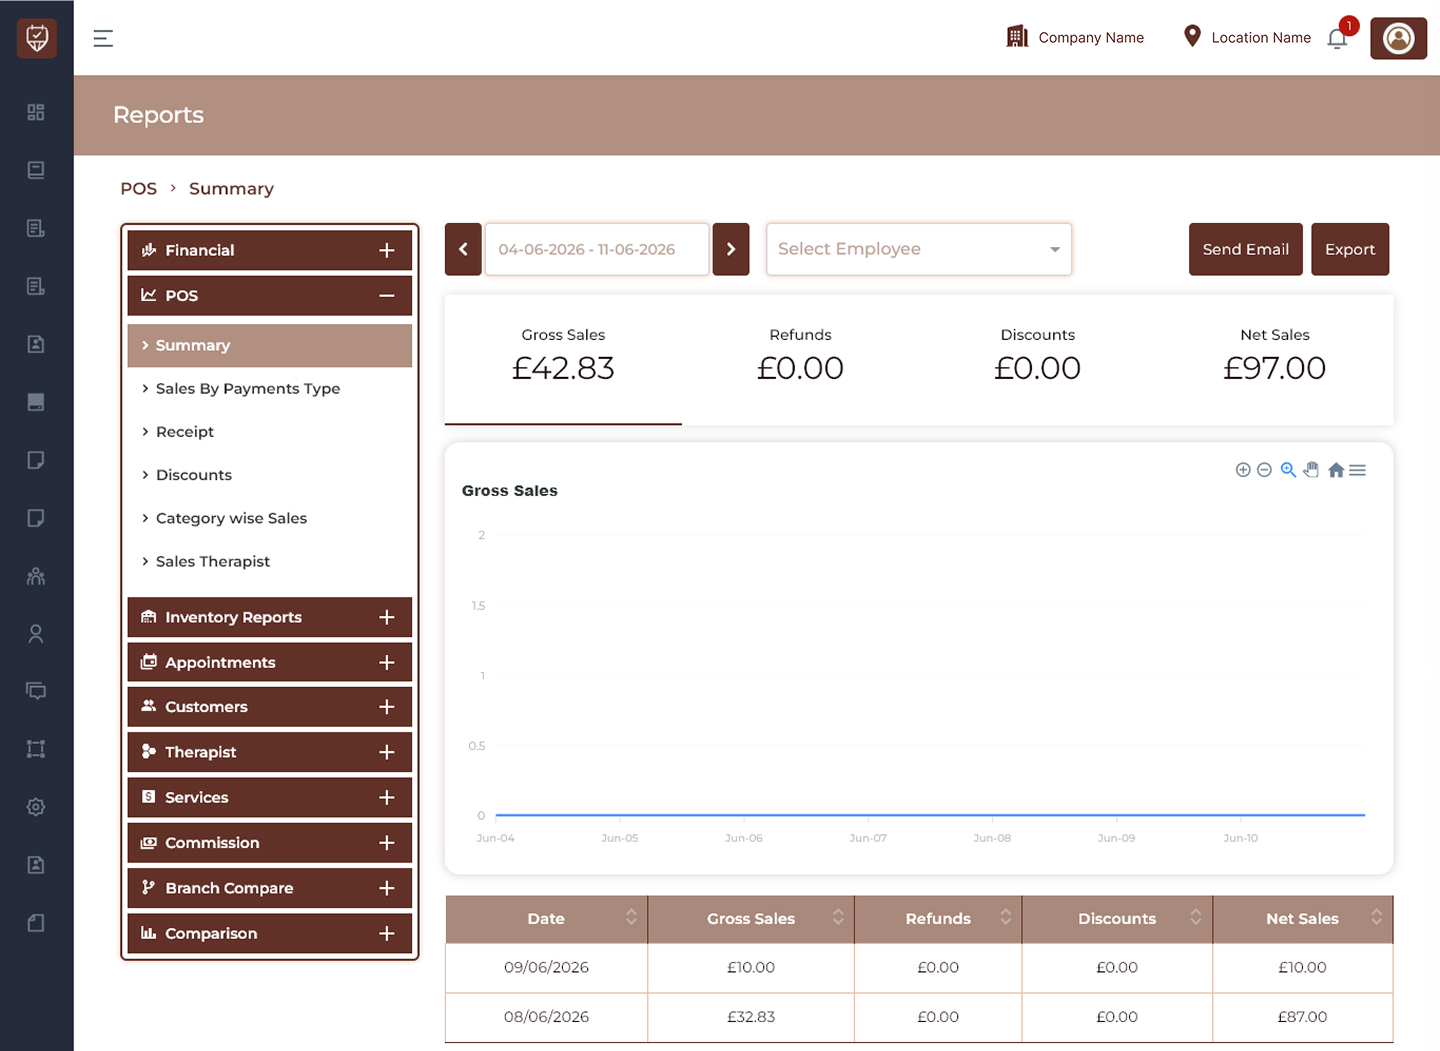
Date Range Filter
Allows users to select the reporting period for POS summary analysis.
Features
- Filter summary data by selected dates.
- Navigate between previous and next periods.
- Refresh report results dynamically.
- Support historical sales review.
Purpose
Used to analyze POS financial performance for a selected period.
Employee Filter
Allows summary data to be filtered for a selected employee.
Features
- Search and select employee records.
- Display employee-related sales activity.
- Simplify performance evaluation.
- Improve reporting precision.
Purpose
Used to review financial performance by employee.
Send Email
Sends the generated summary report to configured recipients.
Features
- Share report data through email.
- Support scheduled reporting workflows.
- Enable remote report access.
- Improve communication and reporting efficiency.
Purpose
Used to distribute summary information electronically.
Export
Downloads the currently displayed POS summary report.
Features
- Export filtered report data.
- Generate downloadable reports.
- Support auditing and financial reconciliation.
- Enable offline reporting.
Purpose
Creates an exportable version of the summary report.
Summary Metrics
Displays key sales indicators for the selected period.
Gross Sales
Displays the total sales amount before adjustments.
Refunds
Displays the total refunded amount.
Discounts
Displays the total discount value applied.
Net Sales
Displays the final sales value after adjustments.
Features
- View financial performance at a glance.
- Compare revenue and deductions.
- Monitor business trends.
- Evaluate sales efficiency.
Sales Trend Chart
Displays sales performance visually across the selected period.
Features
- Visual representation of sales movement.
- Identify trends and fluctuations.
- Support comparative analysis.
- Improve reporting visibility.
Purpose
Helps users understand sales performance over time.
Summary Breakdown
Displays date-based financial totals.
Date
Displays the reporting date.
Gross Sales
Displays total sales before deductions.
Refunds
Displays refunded amounts.
Discounts
Displays discount values applied.
Net Sales
Displays final sales value after adjustments.
Features
- Review period-wise performance.
- Compare daily financial results.
- Validate sales calculations.
- Support operational reporting.
Best Practices
- Select an appropriate date range before analysis.
- Use employee filters for performance evaluation.
- Review refunds and discounts regularly.
- Export reports for record keeping.
- Share reports when collaboration is required.