Dashboard Overview
The Dashboard gives you a real-time snapshot of your business performance for the selected branch and date. It helps you quickly monitor appointments, revenue, cancellations, and payment status — all in one place.
This page explains every section of the dashboard and how to use it effectively.
Top Navigation & Filters
Date Filters
You can switch between:
- Yesterday – View previous day’s performance
- Today – View current day’s data (default view)
- Tomorrow – See upcoming appointments
- Custom – Select a specific date range
Use this to analyze daily, weekly, or custom performance periods.
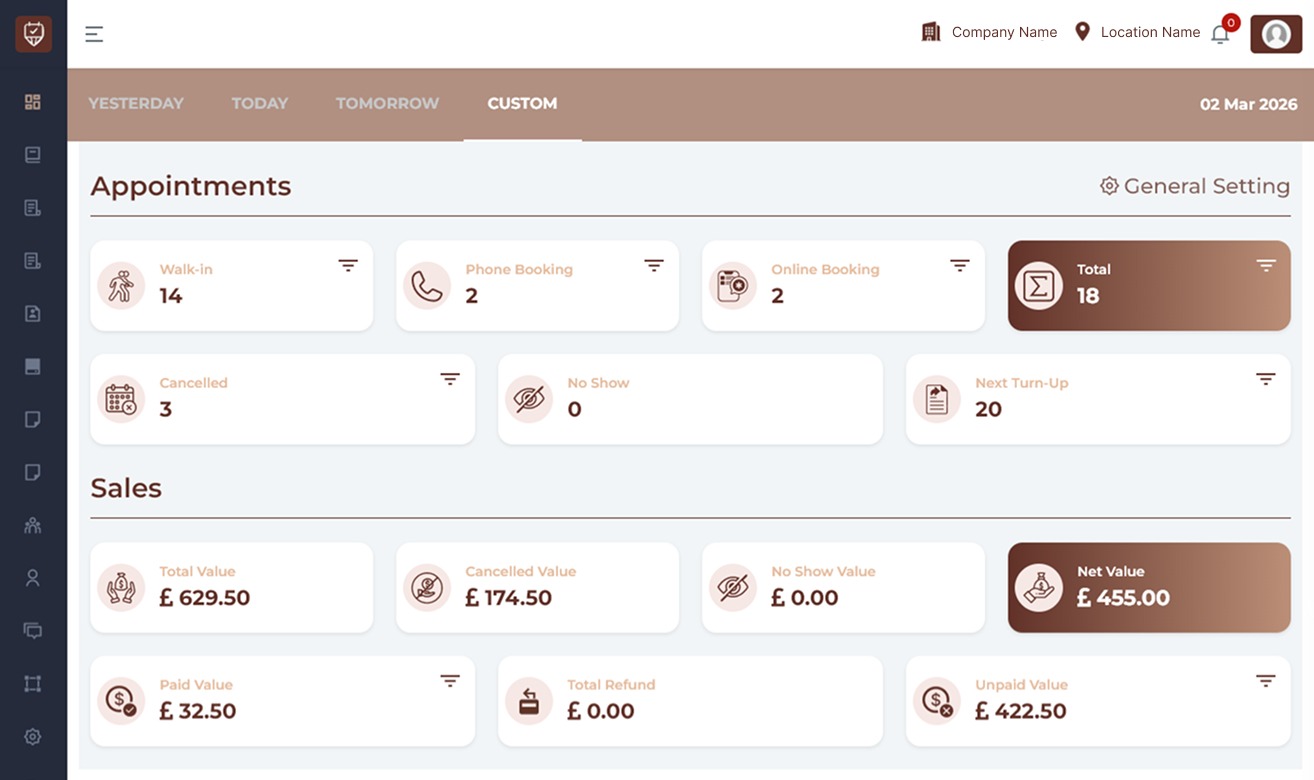
Appointments Section
The Appointments section provides a quick overview of booking activity.
Walk-in
Number of customers who visited without prior booking. This helps measure spontaneous business traffic.
Phone Booking
Appointments created via phone calls. Useful to track staff-handled bookings.
Online Booking
Appointments created through your website or online booking system. Helps measure digital booking performance.
Total
Total number of appointments for the selected date. This includes walk-ins, phone bookings, and online bookings.
Cancelled
Number of cancelled appointments.
High cancellation rates may indicate:
- Poor scheduling
- Pricing concerns
- Customer rescheduling patterns
No Show
Appointments where the customer did not arrive.
Monitoring no-shows helps:
- Improve reminder systems
- Reduce revenue leakage
- Adjust booking policies
Next Turn-Up
Upcoming appointments that are scheduled but not yet completed. This helps staff prepare for the next clients.
Sales Section
The Sales section provides financial insights for the selected period.
Total Value
The total revenue generated from all appointments before adjustments. This includes:
- Completed bookings
- Booked services
Cancelled Value
The total value of cancelled appointments. This helps measure revenue loss due to cancellations.
No Show Value
Revenue impact from no-show appointments. If you charge no-show fees, this may reflect differently.
Net Value
The actual revenue after removing cancelled and no-show values.
Formula : Net Value = Total Value − Cancelled Value − No Show Value
This is your effective earning for the selected date.
Paid Value
Total amount successfully collected from customers.
- Cash payments
- Card payments
- Online payments
Unpaid Value
Amount still pending from customers. Use this to:
- Follow up with clients
- Track outstanding payments
- Monitor cash flow
Total Refund
Amount refunded to customers during the selected period. This helps monitor:
- Refund frequency
- Service issues
- Customer satisfaction trends
How to Use the Dashboard Effectively
Daily Operations
Use the Today filter to:
- Monitor appointment flow
- Track staff workload
- Check real-time revenue
Financial Monitoring
Use the Net Value, Paid, and Unpaid cards to:
- Understand daily cash flow
- Identify pending payments
- Monitor refund impact
Performance Analysis
Use the Custom date filter to:
- Analyze weekly revenue
- Compare performance between dates
- Track business growth trends
Best Practices
- Review dashboard every morning
- Monitor cancellations regularly
- Keep unpaid value low
- Track no-shows and improve reminder system
- Compare daily performance weekly
Frequently Asked Questions
Why is Net Value lower than Total Value?
Because cancelled and no-show appointment values are excluded from net earnings.
Why is Paid Value showing zero?
This means payments have not yet been marked as collected for the selected period.
Does switching branch affect dashboard data?
Yes. All metrics update based on the selected branch.